
Hypothesis Testing - Statistics
Get acquainted with one of the crucial statistical techniques, Hypothesis testing.


Welcome back, readers! We hope you are having a fantastic day today. As always, we encourage you to be better with each day 🌅. So, let’s say you are a researcher and you have recently invented two drugs 💊 that cure a deadly virus. You are renowned now and receiving lots of appreciation from people for your work. But since the conditions are very critical, you need to test the drugs so that the manufacturing unit can start manufacturing the most reliable drug and make it ready for distribution. The question arises, how will you test it statistically?
you need to test the drug on enough people to be sure that the result is not out of randomness or by chance but out of the efficiency of the drug. You will start by testing the drug on a sample of the population of people.
Population vs. Sample
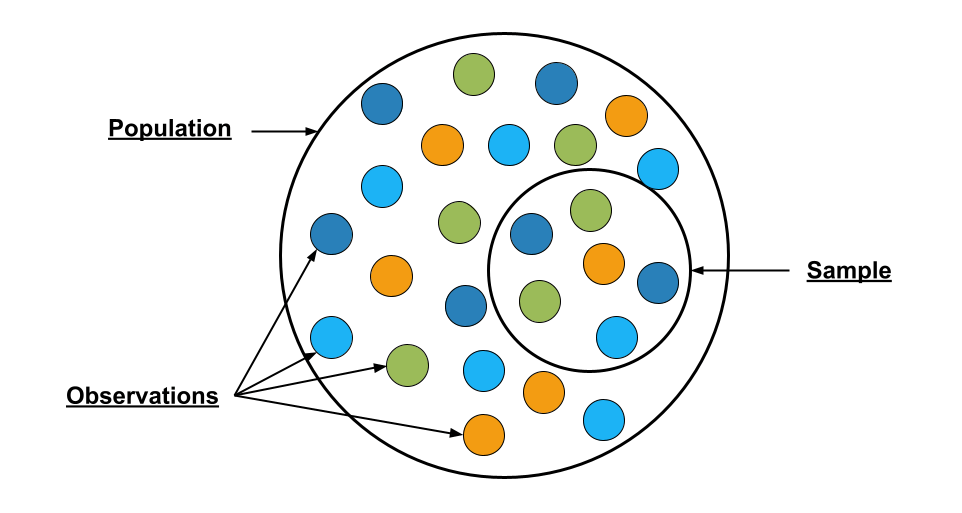 Fig: Population vs. Sample
Population:
A population refers to the complete group of data about which the conclusions are to be drawn. The word population extends its meaning from just humans to objects, species, and measurement of anything that has common traits.
Sample:
A sample is a small part of the population that is generally random. The sample is the smaller representation of the population which is tested to conclude the population.
Having said that, we are ready to understand 😉what is a hypothesis.
What is a Hypothesis?
In statistics, a hypothesis is a statement made on the nature of a population which is testable via experiment or observation.
Let us take an example to understand this complete concept. Given below is some observed data 📊 of two medicines that cure the same disease,
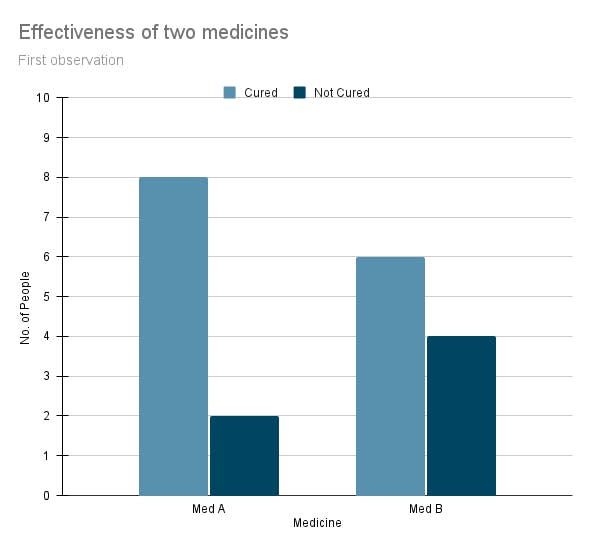 Fig: Test 1 (Forming the hypothesis)
We can see that medicine A has cured 8 out of 10 people, and medicine B has cured just 6 out of 10 people. What hypothesis can we interpret from this data?
After seeing the data, we can say that medicine A is 20% more efficient than medicine B. If this is correct ✔️, then we must be able to achieve similar results from further experimentation. For a hypothesis to be acceptable, it should give similar results as that of the preliminary results. This is where we are required to test a hypothesis.
Hypothesis Testing
 Fig: Process of Hypothesis Testing
Let us perform the same experiment on another ten different people and see if our hypothesis is falsifiable.
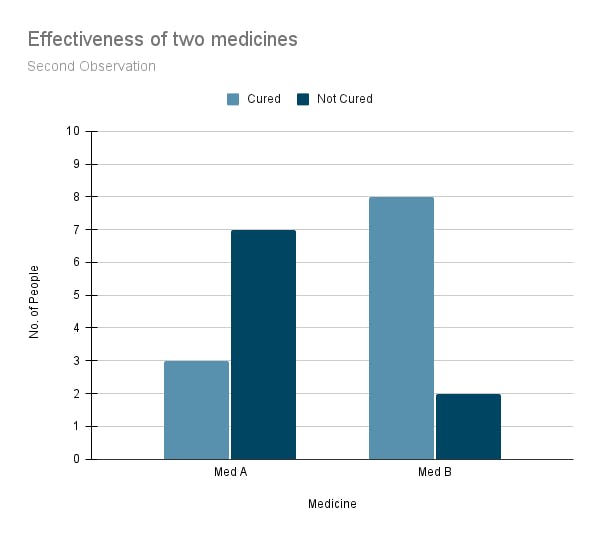 Fig: Test 2
This result was not what we were expecting 😲. We conducted the same test on ten different people, and the results are very different. In fact, they are completely opposite of our preliminary results.
At first, the hypothesis we made was that med A is 20% better than med B, but it seems that is not the case. There can be a chance that all the people who took med B were healthier 💪 than people who took med A, or the medicines might have been interchanged 🔀.
So, we to assume one of the following possibilities as a factor that is affecting the results,
📍 The medicines might have been mislabelled or interchanged.
📍 People who are not cured by medicine A may be weak and can have other disease/s.
📍 People who are cured by medicine B may be healthier than those who took medicine A, i.e., they eat healthily and exercise regularly.
We should try this experiment few more times and observe the results.
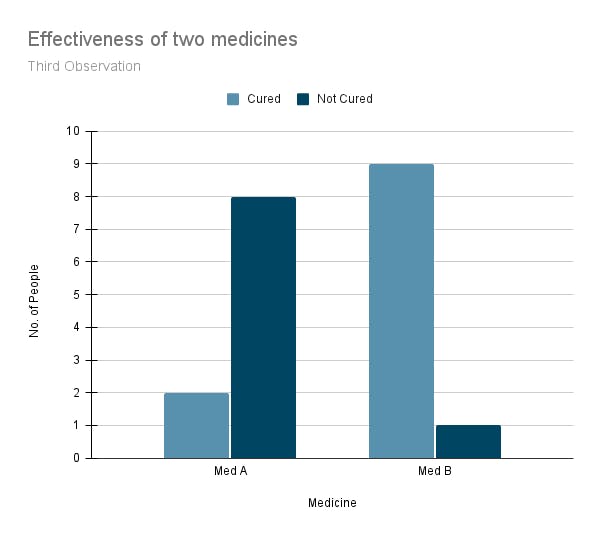 Fig: Test 3
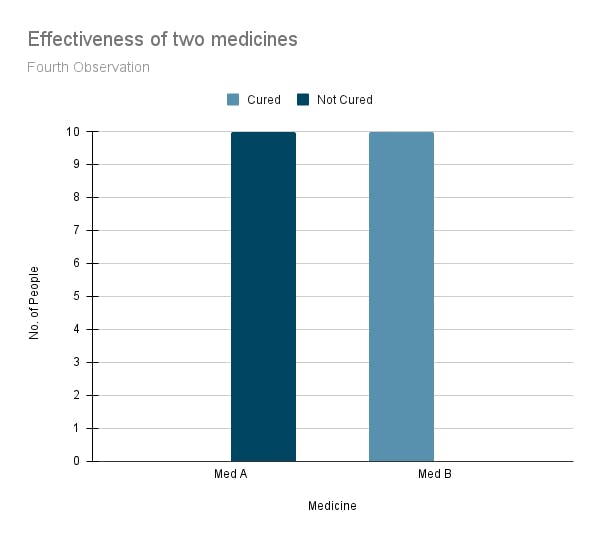 Fig: Test 4
This time, we checked that the medicines are not mislabelled and every other tiny detail. Still, all the experiments show results on the flip side of our preliminary results. Med A is not 20% better than med B, and we are confident that this is not due to random factors.
Hence, we can confidently reject this preliminary hypothesis as we cannot prove it consistently in the experiments.
On the other hand, if the results were not different enough 😃 for us to be confident that med A is not 20% better than med B, i.e., the results were similar, say 19% or 21% or 20.5%, we can say that we have failed to reject the hypothesis.
There are basically two types of hypothesis, namely, Null Hypothesis and Alternate Hypothesis. Let’s look at each of them.
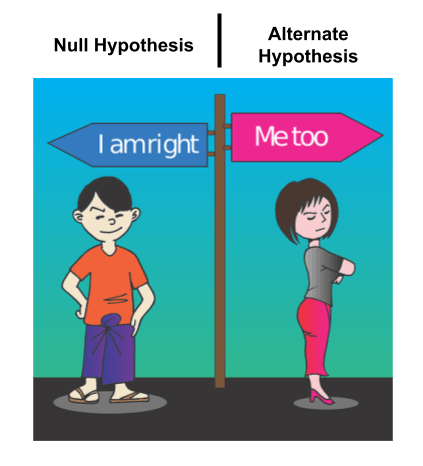
Null Hypothesis:
A null hypothesis (denoted by H0) represents the statement that is exactly the opposite of what we want to prove.
In other words, it states that there is no difference or no direct relationship between the two variables. For example,
We try to prove that the null hypothesis is false. This brings us to the second type.
Alternate Hypothesis:
An alternate hypothesis (denoted by H1) is a statement that is a potential outcome of what we want to prove. In other words, it is a statement made in counter to the null hypothesis. An alternate hypothesis works to verify if there is enough change to reject the null hypothesis.
💡 Null hypothesis- The accepted fact for something
💡 Alternate hypothesis- Your theory for that thing
Let us take the following example.
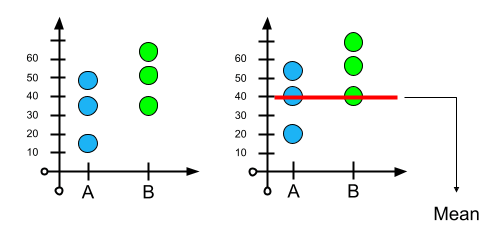 Fig.1 Fig. 2
Fig. 1 shows three people who took med A and three 👦👨👩 people who took med B. Fig 2. shows the meantime of recovery i.e. 40 hours. For people who took med A, we can think that person 1 is healthier 💪 than the rest who took med A. And for people who took med B, person 3 took the longest time to recover, might have some allergies because of which it took him long to recover than the rest of the people who took med B. If this case is considered then the mean recovery time of each med A and med B would be very small. But from the data, when we calculate individual means of med A and B, the difference is significantly more. Based on this, the hypothesis would be:
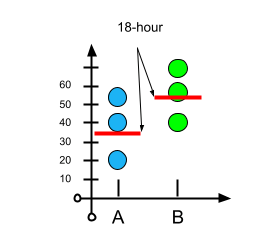 Fig.3
Fig.3
- H1: There is a difference between med A and med B (as the difference of individual mean is different)
But still, even if there is such a case, the difference between the two means is way too large for us to fail to reject the null hypothesis. If the difference was 1 hour or 2 hours, we could not reject the null hypothesis because we know that not every observation is 💯% error-free, and some random factors (as we mentioned above) might affect the results. But the difference is significant from what we observed in this case. Therefore, we can confidently reject the null hypothesis.

This question might have popped into your mind. The answer is the p-value.
What is a P-value?
As we have seen earlier, 📌 when we have enough evidence to prove that a null hypothesis is incorrect, we say that we have rejected the null hypothesis. And when we don’t have enough evidence, we say that we have failed to reject the null hypothesis. But how much value is enough? For this, the p-value and significance value is used.
A p-value (also known as calculated probability) is a value between 0 and 1. In simple terms, it is used to check if enough evidence is available to reject the null hypothesis.
This p-value is checked against a threshold value called significance value(α). The significance value is predetermined; the closer it is to 0, the more significant is the result.
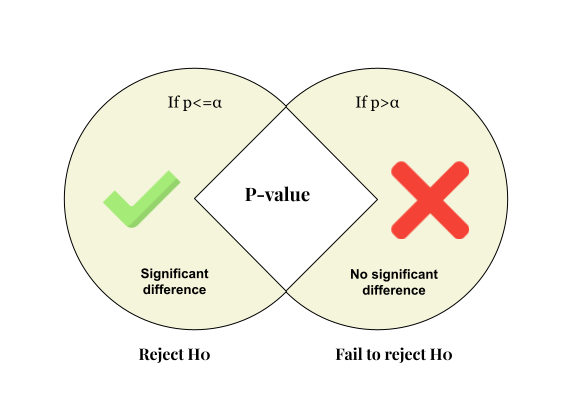
👉 Generally, the p-value is taken as 0.05, which states if there is no difference and when we perform an experiment n number of times, there is a 5% chance that the results will be wrong. When we need to be highly confident to reject the null hypothesis, 0.001 or 0.1% is used as the significance value.
I hope you have got a clear idea 💡 of what is hypothesis testing. Also for live projects and technical videos, check out our👉 YouTube channel and don't forget to like, share and subscribe.
Check out our latest video: How to make a personal portfolio using Github pages